APPENDIX ONE
Best 10 Consecutive Years of WAR Productivity by Catchers All-Time
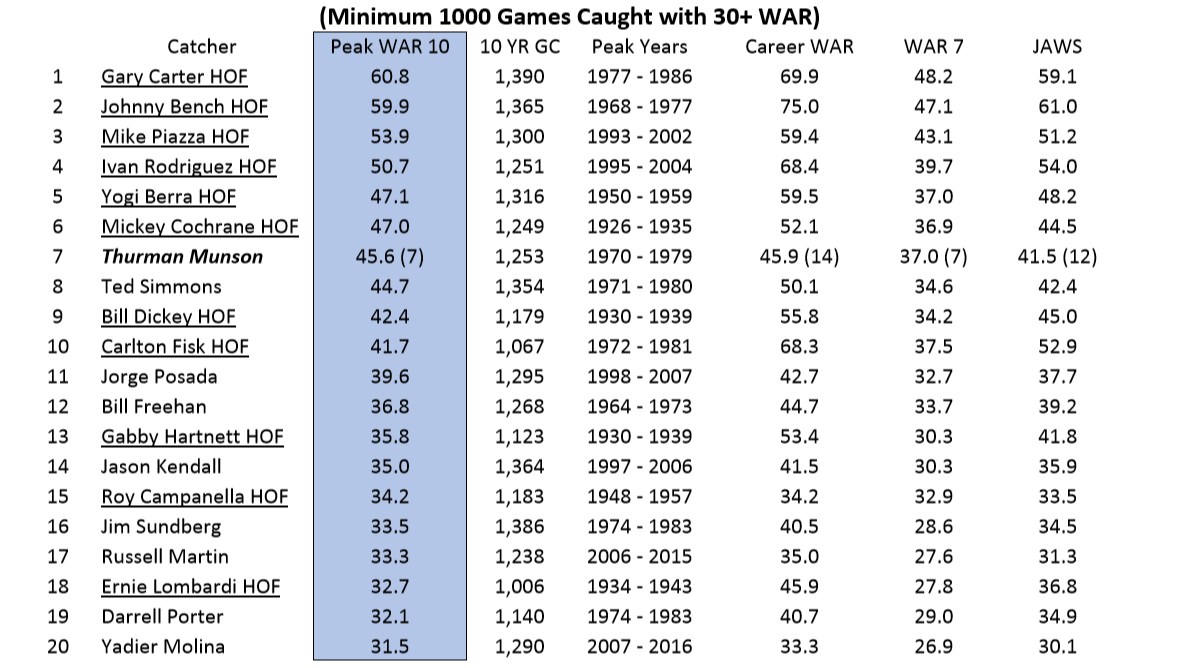
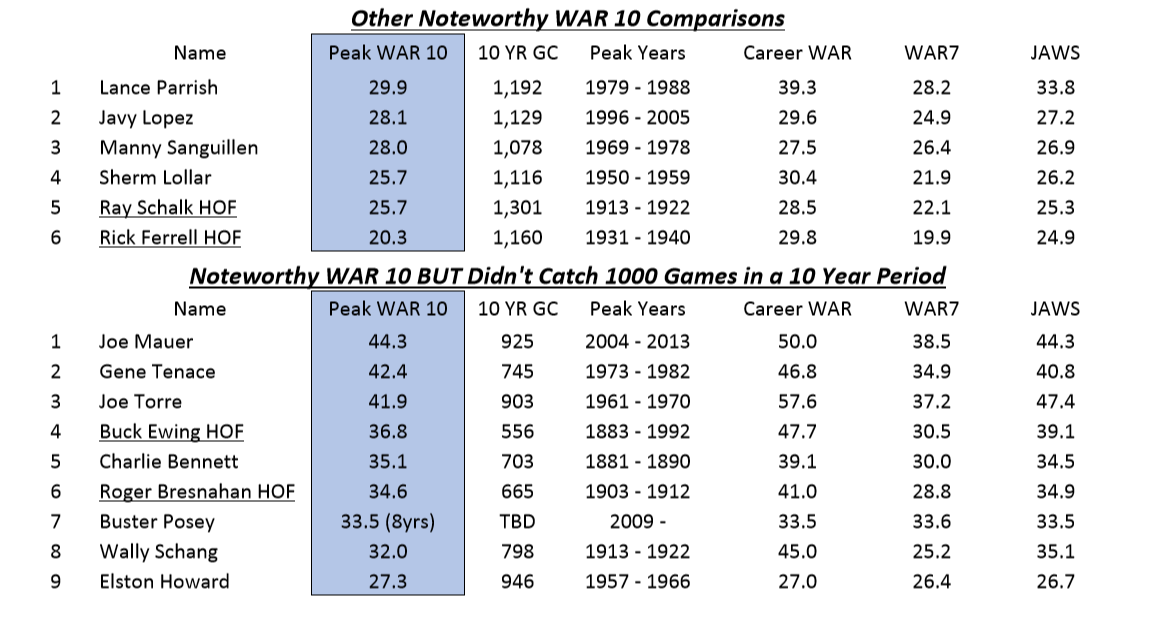
Analytical Point 1: WAR 10 is defined as a Catchers BEST 10 Consecutive Years of WAR Productivity.
Analytical Point 2: There are exactly 20 Catchers in history who have Caught 1000 Games in a decade with a WAR above 30. Analytical Point 3: Many HOF Catchers or those of note who didn’t meet the 1000+ Games threshold appear on the two lists below.
Analytical Point 4: Thurman Munson died with 2 months to go in the 1979 season on August 2, yet still turned in the 7th best decade of WAR by a Catcher!
APPENDIX TWO
A Broader Look at Postseason “Quality Points”
The Performance of Other Noteworthy Catchers in the Postseason vs. Thurman Munson and vs. The AVG HOF Catcher
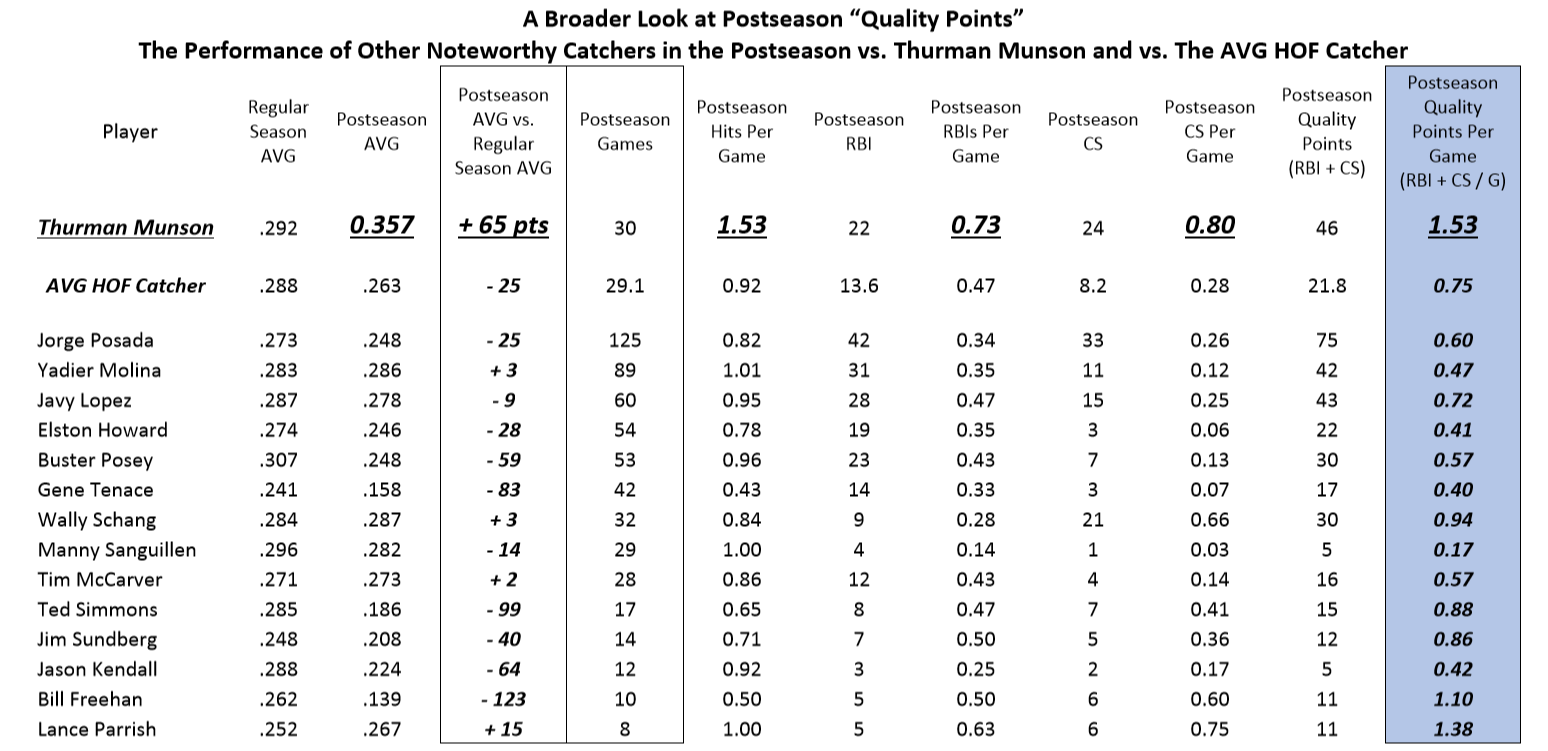
Analytical Point 1: This further illustrates the highly unusual nature of Thurman Munson’s elevated performance in the postseason vs. a wider audience of Catchers.
Analytical Point 2: Thurman Munson not only has a much better RBI per postseason game PLUS CS per postseason game performance than the AVG HOF Catcher, but also against other Catchers of note.
Analytical Point 3: This illustrates the difficulty that Catchers have in significantly elevating batting performance in the postseason vs. their regular season batting performance.
“Postseason Quality Points” Formula = Runs Batted In Per Postseason Game + Defensive Caught Stealing Per Postseason Game
The Catchers on this list were selected for a variety of reasons: 1) significant postseason sample size, 2) respected Catchers in history, 3) notable performance.
20
APPENDIX THREE
The 21 Seasons in Baseball History in Which A Catcher Has Caught 120 Games and Delivered 180 Hits
|
|
|||||
|
Year |
Hits |
Games Caught |
Caught Stealing % |
VS. League CS % |
|
|
Yogi Berra |
1950 |
192 |
148 |
58 |
+ 9 |
|
Ted Simmons |
1972 |
180 |
135 |
32 |
– 5 |
|
Ted Simmons |
1973 |
192 |
153 |
44 |
+ 8 |
|
Ted Simmons |
1975 |
193 |
154 |
26 |
– 6 |
|
Thurman Munson |
1975 |
190 |
130 |
50 |
+ 12 |
|
Thurman Munson |
1976 |
186 |
121 |
35 |
+ 1 |
|
Thurman Munson |
1977 |
183 |
136 |
40 |
+ 1 |
|
Thurman Munson |
1978 |
183 |
125 |
45 |
+ 7 |
|
Ivan Rodriguez |
1996 |
192 |
146 |
51 |
+ 21 |
|
Mike Piazza |
1996 |
184 |
146 |
18 |
– 10 |
|
Mike Piazza |
1997 |
201 |
139 |
28 |
– 4 |
|
Ivan Rodriguez |
1997 |
187 |
143 |
57 |
+ 24 |
|
Ivan Rodriguez |
1998 |
186 |
139 |
56 |
+ 25 |
|
Mike Piazza |
1998 |
184 |
140 |
26 |
– 6 |
|
Ivan Rodriguez |
1999 |
199 |
141 |
55 |
+ 22 |
|
Jason Kendall |
2000 |
185 |
147 |
30 |
– 2 |
|
Jason Kendall |
2003 |
191 |
146 |
27 |
– 4 |
|
Jason Kendall |
2004 |
183 |
146 |
36 |
+ 8 |
|
Javy Lopez |
2004 |
183 |
132 |
28 |
– 4 |
|
Joe Mauer |
2006 |
181 |
120 |
38 |
+ 8 |
|
Victor Martinez |
2006 |
181 |
133 |
18 |
– 12 |
|
Analytical Note 1: Yogi Berra won a World Series Title in 1950 and Thurman Munson won in 1977 and 1978. |
|||||
|
Analytical Note 2: Thurman Munson won the MVP Award in 1976 and Ivan Rodriguez won in 1999. |
|||||
|
Analytical Point 3: If you further refine for CS% above League AVG, 9 seasons fall off this list. |
Research Note
This research effort began by taking notice of the unusual statistical comparison between Thurman Munson and Ivan Rodriguez in that they are still the only Catchers in the history of baseball to have 4 straight seasons of at least 180 hits. The above chart demonstrates how unusual it is for Catchers to be able to both play the position for a large number of games and hit for a high enough average to grind out 180 hits. It may be a fair criticism to say that some of the hits within the seasonal hit totals above by individual players may not have come in only games in which they were catching, but it is our point of view that the demands of the position don’t begin and end on the day in which a game is caught. It is a position of constant preparation and recovery. So even if a certain number of the hits were delivered, for example, while playing first base it still doesn’t diminish the unique accomplishment of catching at least 120 games and delivering
180 hits. It is worth noting that in the history of baseball the top 20 hit total seasons all-time for players of any position show totals between 237 and 262. The fact that the top 20 hit totals seasons for Catchers run between 180 and 201 is further validation of the point: it is really hard to endure the physical demands of the position and still hit for a high average with great consistency. By further refining this list of players to only those who were above their league average in Caught Stealing Percentage seemed like an interesting way to further refine the impressive nature of the accomplishment by isolating exactly those 12 seasons in which a Catcher could play a lot of games, gather a lot of hits, and be effective in those critical defensive moments when the base paths were under pressure. The fact that Thurman Munson was the first man to achieve this accomplishment 4 years in a row was perhaps the single best statistical validation of the type of player he was. The fact that the only other player in history to duplicate Thurman’s feat was, definitively, one of the all-time greats at the position, and is now a first ballot Hall of Famer is validation that Thurman Munson’s overall record is worth a renewed closer examination. This was our objective in this project.
Notes on Research Methodology and Data Sources
This page is offered to provide details on the sources of data that were used in the course of this research and it is intended to provide some level of clarity on why certain “analytical choices” were made. Every research effort requires choices to be made and here we intend to be transparent on our decisions.
WAR 10: 1000 Games Caught in 10 Consecutive Years
This is one of the key drivers of our conclusions. There are a few reasons why we chose to use 10 consecutive years and
1000 games caught as important benchmarks. First, it coincides exactly with the duration of Munson’s career between his Rookie Season in 1970 and his death in 1979. Second, in the history of baseball it became very clear that the overwhelming majority of strong productivity by even the best Catchers in the game is concentrated fairly tightly to a period of 10 years. For example, if you take the Top 10 WAR 10 Catchers (40+ WAR) they played a total of 77 seasons outside of their peak decade and only 12 of those 77 additional seasons showed WAR productivity above 3. If you take the next 10 WAR 10 Catchers (30+ WAR), they played an additional 51 seasons outside of their peak decade with only 5 of those seasons showing WAR above 3. In short, this means that of the 128 seasons played by the Top 20 WAR 10
Catchers outside of their peak decades, only 17 of those seasons showed relatively strong WAR performance. And third, we thought it was important when measuring the relative productivity of Catchers over time that we focus exactly on those players who met a certain minimum threshold of playing the position over a full decade in which most of the games they played was as a Catcher. Choosing the number 1,000 was admittedly somewhat arbitrary but it did require the players highlighted within the analysis to play an average of 100 games at the Catcher position for 10 years straight. When performing this refinement a few interesting names fall out of the analysis which serves to highlight how difficult it is for even some of the great Catchers in the game to sustain the ongoing physical demands of the position over many years. But in short, we thought it was important that to effectively compare the productivity of Catchers we needed to isolate those players who produced most of their WAR while actually playing the position of Catcher.
Postseason Quality Points (RBIs Per Postseason Game Plus Defensive Caught Stealing Per Postseason Game)
Admittedly this statistic is a new creation, and it seeks to establish a blended measure of both offensive and defensive production by Catchers in the postseason. RBIs are chosen as the offensive metric because it requires the player to be effective in the most critical moments in the game when runs are available on the bases to be driven in. The comparison of Munson’s productivity in this area to that of Hall of Fame Catchers, and every other noteworthy Catcher in the history of the game, produced an interesting result worth sharing. Likewise, on the defensive side of the equation we believe that defensive Caught Stealing productivity is as clean a way as possible to measure the effectiveness of the Catcher in protecting his pitchers by slowing down the base paths. This analysis also produced results worth sharing and made some comparisons throughout history very interesting. By combining both metrics into one per game number it seemed to nicely measure how effective in combination a Catcher was in helping his team win in the postseason relative to the performance of other great catchers over time. It’s not perfect but it is offered for consideration as a useful statistic.
Postseason Batting and Postseason Defense
Sean Lahman’s Postseason Batting and Postseason Fielding Archives were the primary data sources used in delivering all analysis and conclusions in these areas.
Teams Stealing Productivity
Sean Lahman’s Teams Archive was the primary data source in delivering all analysis and conclusions in this area.
Regular Season WAR, Hit Totals, and RBIs
Baseball-Reference.com and Sean Lahman’s Batting Archive were the key sources of information for all player-specific regular season productivity metrics.
Summary Points on the Unique Accomplishments in the Career of Thurman Munson
Munson is one of exactly 10 Catchers in history to catch 1000+ games and produce 40+ WAR in 10 consecutive seasons Produced 45.6 WAR from 1970-1979: only 6 Catchers – all Hall of Famers – ever delivered more in any 10 year period His .357 postseason batting average is 94 points higher than the Hall of Fame Catcher average
Only Catcher in history to throw out at least 7 base runners Caught Stealing in 3 different postseasons
Only Catcher in history to throw out at least 3 base runners Caught Stealing in 6 different postseason series
His combination of RBIs per postseason game and CS per postseason game is the best in history amongst Catchers
His hits per postseason game is higher than every Hall of Fame Catcher His RBIs per postseason game is higher than every Hall of Fame Catcher More postseason defensive CS than every Hall of Fame Catcher
Higher postseason OPS (.874) than every Hall of Fame Catcher except one
First Catcher in history with 4 consecutive 180+ hit seasons
Thurman is the last American League Catcher with 3 consecutive seasons with a .300+ average and 100+ RBIs
One of two American League Catchers in the last 100 years with 3 straight .300+ average / 100+ RBI seasons
492 of the 500 players in history with the most postseason At Bats have a lower batting average than Thurman Munson The 7 players among those 500 with a higher average than Munson are all Hall of Famers and none were Catchers Munson’s 190 Hits in 1975 was the closest ever a Catcher came to the league leader in hits (Brett / 195)
Munson hit safely in 27 of 30 postseason games – no other player has ever done that!
Incidentally, Joe DiMaggio hit safely in 24 of his first 30 postseason games!
Only Catcher in history to catch back to back Cy Young Award winners and win the World Series both years Munson and Ron Guidry are the only Pitcher/Catcher pair with an 18+K game and a World Series win in the same year Every game he played in the postseason as Captain of the Yankees his team was facing a Hall of Fame Manager Munson led his team to more postseason series wins against Hall of Fame Managers (5) than any Hall of Fame Catcher The HOF Catchers who played during or after Munson have a combined 3 postseason series wins vs. HOF Managers The 3 HOF Catchers who played during the 1970s have exactly zero postseason series wins against HOF Managers
One of only 9 players in history with a Rookie of the Year Award, MVP, Gold Glove, and a World Series Championship
Thurman Munson was, definitively, one of the greatest Catchers in the history of the game!